Edit chart
Loading graph
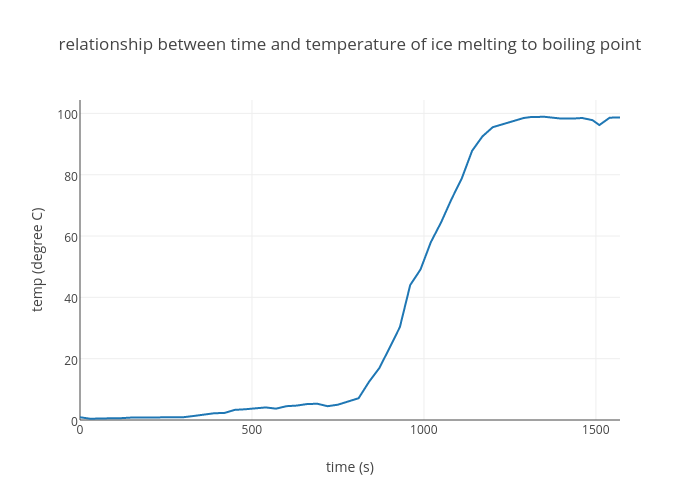
17bell_n's interactive graph and data of "relationship between time and temperature of ice melting to boiling point " is a scatter chart, showing temp (degree C); with time (s) in the x-axis and temp (degree C) in the y-axis.. The x-axis shows values from 0 to 1570. The y-axis shows values from 0 to 104.37222222222223.