Edit chart
Loading graph
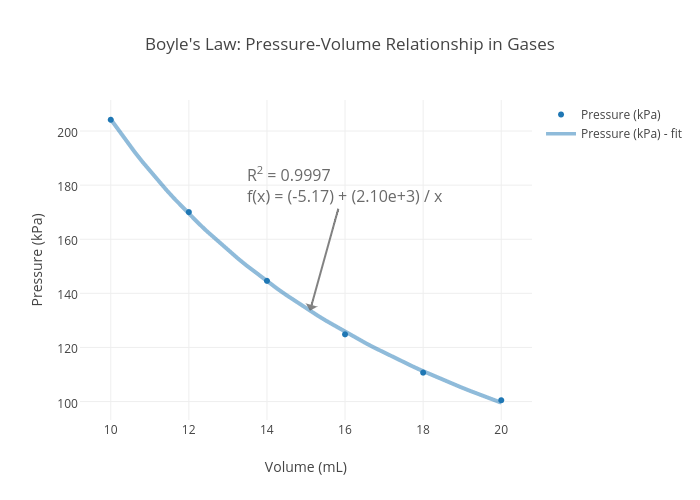
17_gstreeter's interactive graph and data of "Boyle's Law: Pressure-Volume Relationship in Gases" is a scatter chart, showing Pressure (kPa) vs Pressure (kPa) - fit; with Volume (mL) in the x-axis and Pressure (kPa) in the y-axis.. The x-axis shows values from 9.390402075226978 to 20.609597924773023. The y-axis shows values from 93.20350877192983 to 211.44649122807016. This visualization has the following annotation: R2 = 0.9997f(x) = (-5.17) + (2.10e+3) / x