0.2
0.3
0.4
0.5
0.6
0.7
0.8
0.9
1
0.5
1
1.5
2
Absorbance
Absorbance - fit
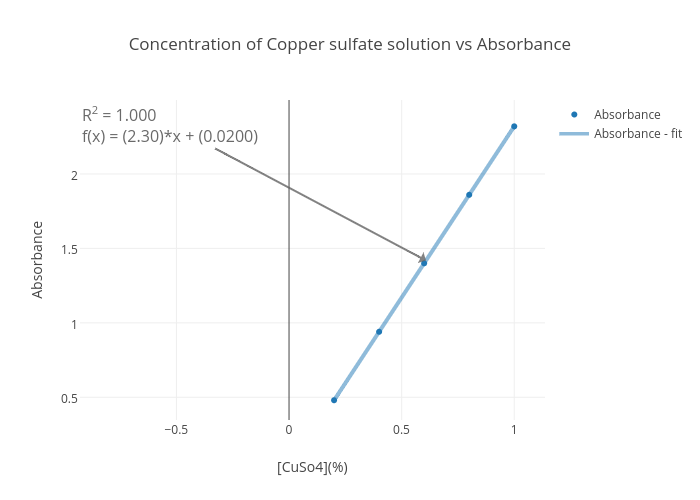
Concentration of Copper sulfate solution vs Absorbance
[CuSo4](%)
Absorbance
R
2
= 1.000
f(x) = (2.30)*x + (0.0200)
plotly-logomark
Edit chart
17_ksewester's interactive graph and data of "Concentration of Copper sulfate solution vs Absorbance" is a scatter chart, showing Absorbance vs Absorbance - fit; with [CuSo4](%) in the x-axis and Absorbance in the y-axis.. The x-axis shows values from 0.15129189050908162 to 1.0487081094909183. The y-axis shows values from 0.3516206073012624 to 2.4483793926987376. This visualization has the following annotation: R2 = 1.000f(x) = (2.30)*x + (0.0200)