80
100
120
140
160
180
200
220
150
200
250
300
350
400
450
500
550
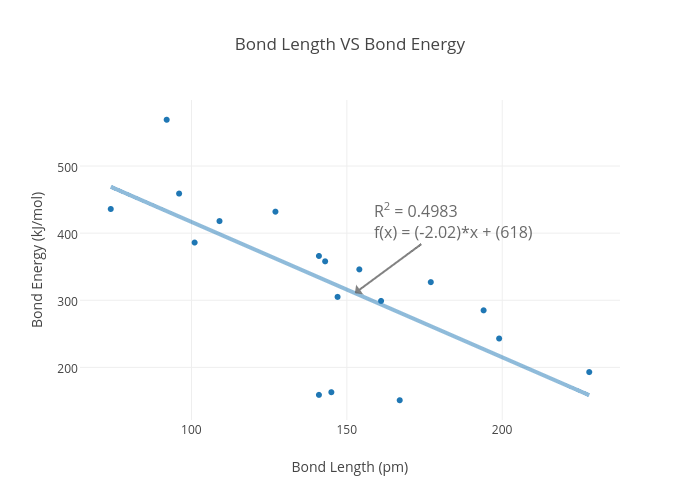
Bond Length VS Bond Energy
Bond Length (pm)
Bond Energy (kJ/mol)
R
2
= 0.4983
f(x) = (-2.02)*x + (618)
plotly-logomark
Edit chart
16pfeilervs's interactive graph and data of "Bond Length VS Bond Energy" is a scatter chart, showing Bond Energy (kJ/mol) vs Bond Energy (kJ/mol) - fit; with Bond Length (pm) in the x-axis and Bond Energy (kJ/mol) in the y-axis.. The x-axis shows values from 64.42689502061529 to 237.5731049793847. The y-axis shows values from 121.46739130434783 to 598.5326086956521. This visualization has the following annotation: R2 = 0.4983f(x) = (-2.02)*x + (618)