Edit chart
Loading graph
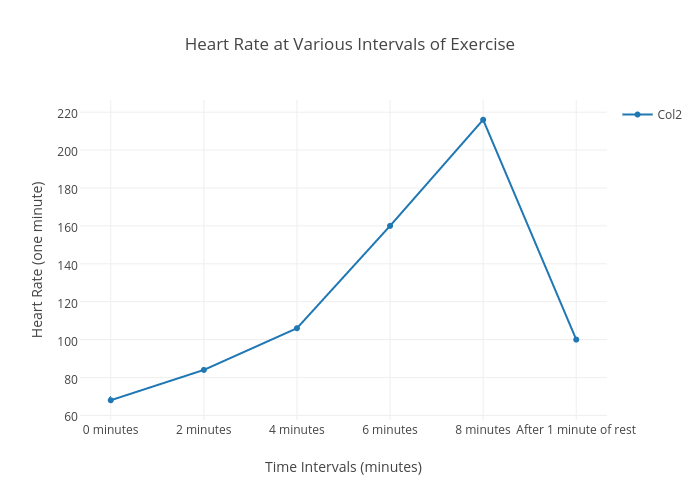
16kaufdak's interactive graph and data of "Heart Rate at Various Intervals of Exercise" is a scatter chart, showing Col2; with Time Intervals (minutes) in the x-axis and Heart Rate (one minute) in the y-axis.. The x-axis shows values from -0.27777777777777785 to 5.277777777777778. The y-axis shows values from 59.77777777777778 to 224.22222222222223.