Edit chart
Loading graph
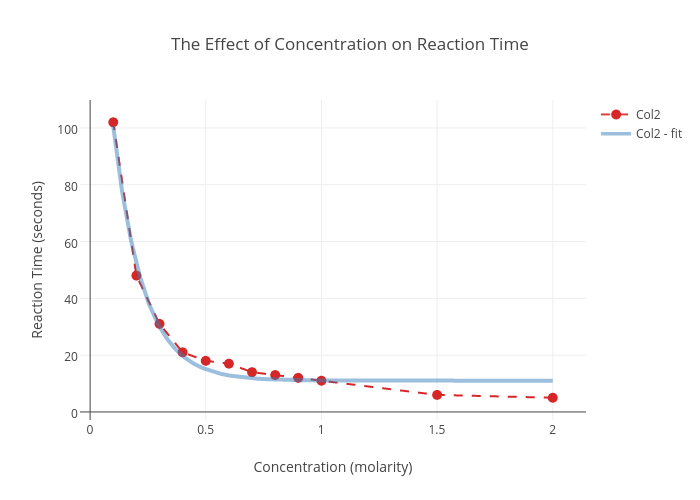
161weinere's interactive graph and data of "The Effect of Concentration on Reaction Time" is a scatter chart, showing Col2 vs Col2 - fit; with Concentration (molarity) in the x-axis and Reaction Time (seconds) in the y-axis.. The x-axis shows values from -0.005555555555555564 to 2.1055555555555556. The y-axis shows values from -0.3888888888888893 to 107.38888888888889.