Edit chart
Loading graph
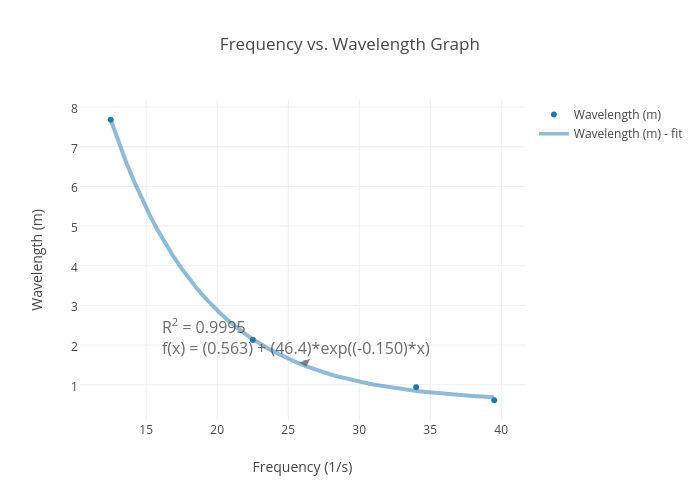
151829's interactive graph and data of "Frequency vs. Wavelength Graph" is a scatter chart, showing Wavelength (m) vs Wavelength (m) - fit; with Frequency (1/s) in the x-axis and Wavelength (m) in the y-axis.. The x-axis shows values from 10.852883483719106 to 41.147116516280896. The y-axis shows values from 0.11083604189237989 to 8.179163958107619. This visualization has the following annotation: R2 = 0.9995f(x) = (0.563) + (46.4)*exp((-0.150)*x)