Edit chart
Loading graph
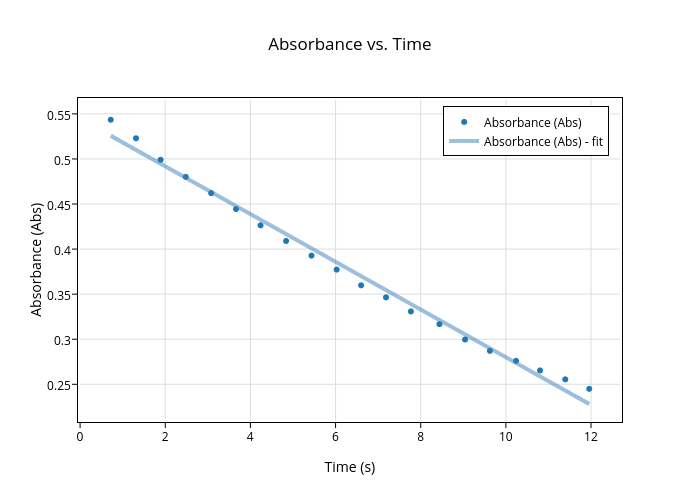
14muniee's interactive graph and data of "Absorbance vs. Time" is a scatter chart, showing Absorbance (Abs) vs Absorbance (Abs) - fit; with Time (s) in the x-axis and Absorbance (Abs) in the y-axis.. The x-axis shows values from 0.0559815756055273 to 12.622351757694473. The y-axis shows values from 0.21033106924889805 to 0.5662541727415784.