Edit chart
Loading graph
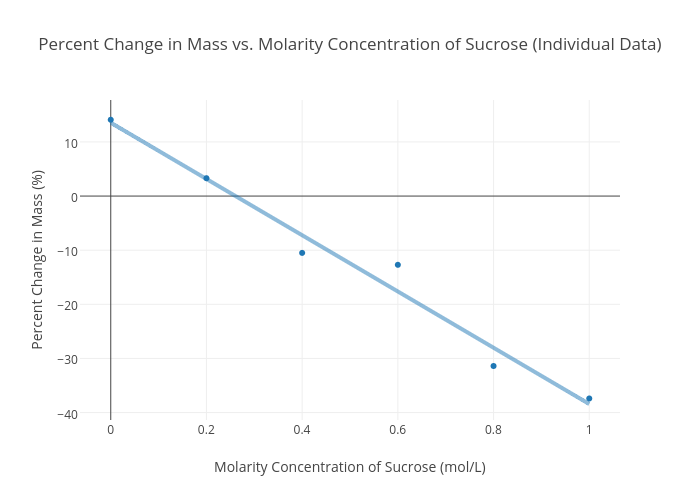
10017557's interactive graph and data of "Percent Change in Mass vs. Molarity Concentration of Sucrose (Individual Data)" is a scatter chart, showing Percent Change in Mass (%) vs Percent Change in Mass (%) - fit; with Molarity Concentration of Sucrose (mol/L) in the x-axis and Percent Change in Mass (%) in the y-axis.. The x-axis shows values from -0.07437102571191595 to 1.074371025711916. The y-axis shows values from -41.36586826726431 to 17.570544697070424.