Structure
Traces
Subplots
Theme
Style
Annotate
Analyze
Export
JSON
Trace your data.
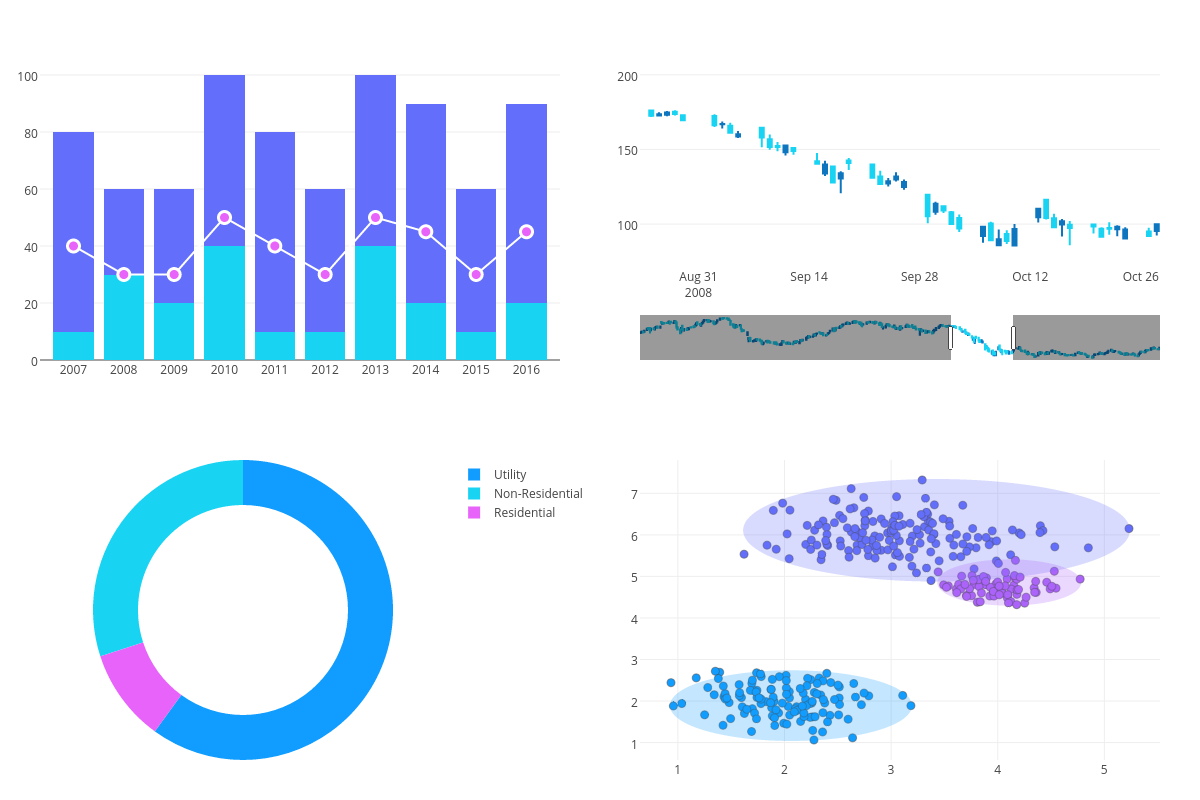
Traces of various types like bar and line are the building blocks of your figure.
You can add as many as you like, mixing and matching types and arranging them into subplots.
Click on the + button above to add a trace.
