Edit chart
Loading graph
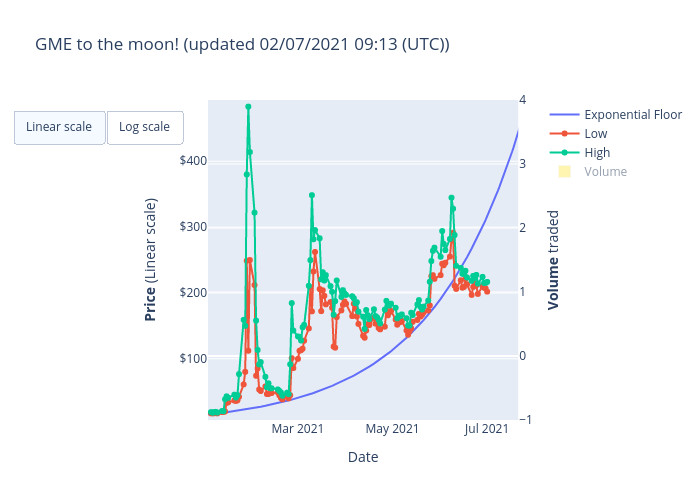
Optf's interactive graph and data of "GME to the moon! (updated 02/07/2021 09:13 (UTC))" is a line chart, showing Exponential Floor, Low, High, Volume; with Date in the x-axis and Price (Linear scale) in the y-axis.. The x-axis shows values from 2021-01-02T00:00:00 to 2021-07-21T00:00:00. The y-axis shows values from 7.079999923706055 to 493.0.