Edit chart
Loading graph
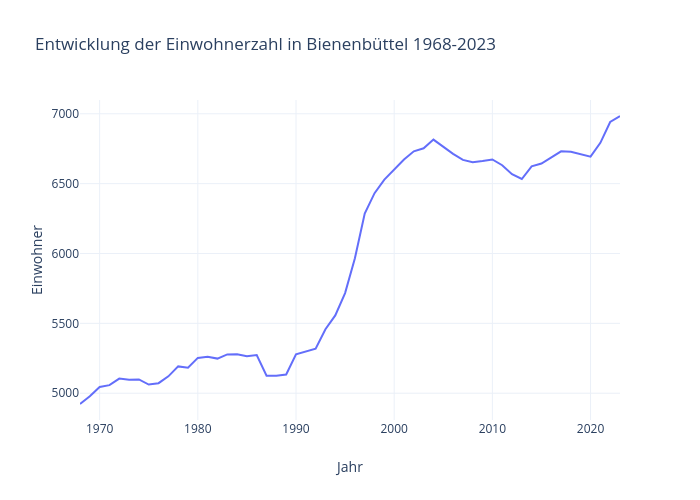
Kalapuskin's interactive graph and data of "Entwicklung der Einwohnerzahl in Bienenbüttel 1968-2023" is a line chart, showing Einwohner; with Jahr in the x-axis and Einwohner in the y-axis.. The x-axis shows values from 1968 to 2023. The y-axis shows values from 4808.5 to 7098.5.