Edit chart
Loading graph
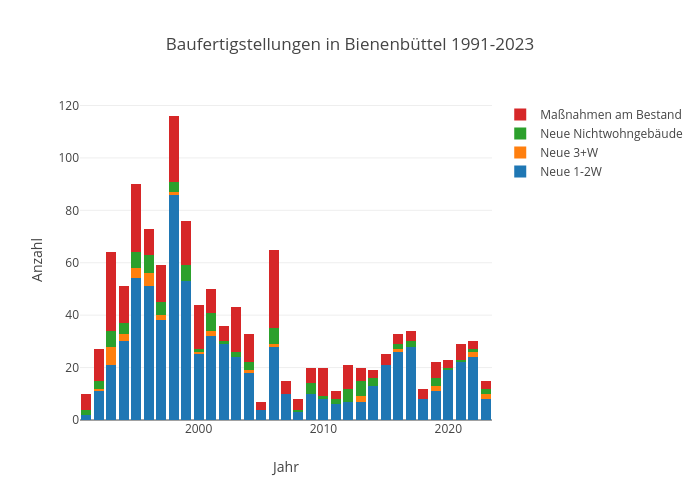
Kalapuskin's interactive graph and data of "Baufertigstellungen in Bienenbüttel 1991-2023" is a stacked bar chart, showing Neue 1-2W, Neue 3+W, Neue Nichtwohngebäude, Maßnahmen am Bestand; with Jahr in the x-axis and Anzahl in the y-axis.. The x-axis shows values from 1990.5 to 2023.5. The y-axis shows values from 0 to 122.10526315789474.